
Examples
The MATLAB examples files could be found
[here].
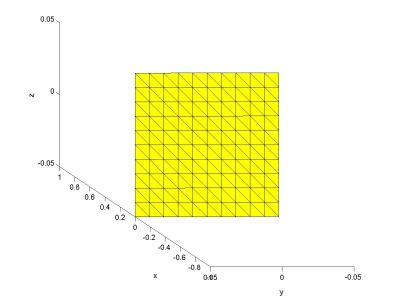
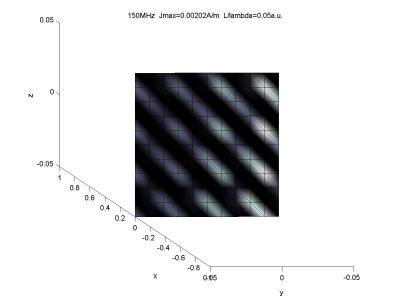
Example#1 - Current distribution for a square metal plate at a single frequency.
In this example we define the metal plate by calling the function
'g_plate'. The size of the square plate is taken as 0.1 m and the
discretization is 10 rectangles along the length and width. A Z polorized wave is incident
on the plate along the positive direction of X axis. The structure 'const' defines
parameters such as epsilon, mu, speed of light etc. Once the plate and
the incident wave are defined we execute 'rwgm' to create a structure
'geom' which defines all the parameters of the metal triangles including
the self integrals. The plate is displayed by using the function
'viewer'. The current distribution on the plate is observed at a single
frequency of 150 MHz which corresponds to half a wavelength.
To calculate the current distribution we first need to calculate the
voltage vector. This is done by calling the function 'voltage'. Also the
value of impedance matrix is to be calculated by calling the function 'zmm'. With the
values of voltage and impedance calculated, the current vector is
obtained using the function 'slv'. The three functions (voltage, zmm and slv) are
combined in a function 'solver' which directly outputs the current
vector. The current density for every patch is calculated using the
function 'current' which takes input arguments 'geom' and 'I'. The
current density on the plate is displayed by calling the function
'viewer'.
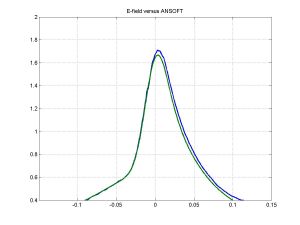
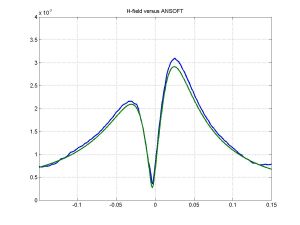
Example# 4 Near field of the metal grid compared to ANSOFT HFFS v.8.5
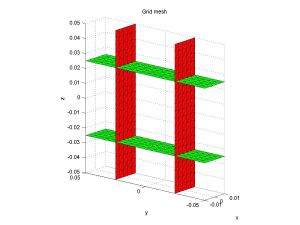
In this example we define the metal grid by calling the function
'g_grid'. The size of the grid is taken as 0.1 m and 0.1/5 in depth.The
discretization is 10 rectangles along the length for each cell and 5
rectangles in the depth.. A Z polorized wave is incident on the grid
along the positive direction of X axis. The structure 'const' defines
parameters such as epsilon, mu, speed of light etc. Once the grid and
the incident wave are defined we execute 'rwgm' to create a structure
'geom' which defines all the parameters of the metal triangles including
the self integrals. The grid is displayed by using the fuction
'viewer'. The near field of the grid is observed at a single
frequency of 3 GHz. To calculate the near field we first need to calculate the
voltage vector. This is done by calling the function 'voltage'. Also the
value of impedance matrix is to be calculated by calling the function 'zmm'. With the
values of voltage and impedance calculated, the current vector is
obtained using the function 'slv'. The three functions (voltage, zmm and slv)are
combined in a function 'solver' which directly outputs the current
vector. The near field of the plate is calculated by calling the
function 'field'. This function calculates the scattered electric and
magnetic field along with the Poynting vector. In the end the results
of the scattered electric and magnetic fields are plotted and are
compared to ANSOFT HFSS v 8.5.
|
![[Next]](http://www.wpi.edu/Buttons/next.gif)